
How to Optimize OLED Displays Colorimetry Using High-Resolution Microscope Spectrophotometers
Modern Organic Light-Emitting Diode (OLED) displays continue to pack more pixels into less space, delivering sharper images and richer colors than ever before. That progress, however, has introduced a subtle measurement challenge. When neighboring sub-pixels are separated by only a few micrometers, conventional color measurement techniques, like spot colorimetry and imaging colorimetry, can struggle to distinguish one emitter from the next. High-resolution microscope spectrophotometers provide the precision needed to optimize OLED displays colorimetry without sacrificing measurement accuracy.
The Microscopic Challenge of OLED Displays Colorimetry
Every OLED display generates images using microscopic red, green, and blue OLEDs arranged into closely spaced sub-pixels. Together, they produce the brightness and color accuracy expected from modern smartphones, automotive displays, augmented reality devices, and countless other applications. Increasing pixel density improves image quality, but it also makes meaningful optical characterization substantially more difficult.
As sub-pixels become smaller, conventional colorimeters struggle to isolate a single emitter. Instead, they collect light from relatively large sampling areas, averaging the optical output of multiple adjacent sub-pixels. Their spatial averaging can conceal cross-talk, localized defects, and subtle spectral variations, preventing OLED displays colorimetry from accurately representing the performance of individual emitters.
A microscope spectrophotometer overcomes such a limitation by isolating microscopic emission regions and measuring their absolute spectral power distribution. The outcome is high-resolution spectral data that reflects the true optical characteristics of each sub-pixel, offering a stronger foundation for display optimization.
How a Microscope Spectrophotometer Works
Unlike conventional display metrology systems, a microscope spectrophotometer combines high-magnification optical imaging with precision spectroscopy to perform localized, non-destructive spectral analysis. Engineers can examine microscopic emission regions directly, producing measurements that closely reflect the optical behavior of sub-pixels.
Microscope spectrophotometers achieve accurate OLED measurements through several key capabilities:
- Permanently calibrated, variable apertures isolate individual sub-pixels or selected regions within a sub-pixel, preventing contamination from adjacent emitters
- A direct optical path maximizes light collection from microscopic emission sources while minimizing optical distortion associated with fiber coupling and polarization effects
- High spectral resolution captures complete UV, visible, and near-infrared emission spectra, enabling detailed analysis beyond generalized color coordinates.
Full spectral data ensures engineers can evaluate emission peak position, spectral bandwidth, and material performance. Rather than observing only calculated chromaticity values, they gain insight into the physical behavior of the organic emissive layers responsible for OLED displays colorimetry.
Step-by-Step: Optimizing OLED Displays Colorimetry With Microscope Spectrophotometers
Locating a single active sub-pixel is critical for accurate optimization. High-resolution optical imaging, paired with synchronized mirrored apertures, enables a microscope spectrophotometer to target a microscopic emission zone without touching the display surface. Precise alignment eliminates unwanted light from neighboring pixels before spectral acquisition begins. Consistent positioning also improves measurement repeatability during comparative testing across multiple devices and production batches.
Next, the microscope spectrophotometer records the complete spectral power distribution generated by the active organic materials. The measurement captures the full emission spectrum, allowing engineers to identify exact peak wavelengths and subtle spectral variations.
Following acquisition, specialized software converts the measured spectrum into quantitative colorimetric values. The software calculates:
- Commission Internationale de l'Éclairage (CIE) chromaticity coordinates
- Luminance
- Correlated color temperature (CCT)
- Dominant wavelength
- Spectral purity.
Finally, the results become part of an iterative manufacturing workflow. Measured values are compared against target color spaces such as DCI-P3 or Rec. 2020. Any deviation provides immediate feedback for adjusting organic material deposition, refining evaporation parameters, improving encapsulation consistency, or tuning OLED driver currents. Because every measurement originates from an individual sub-pixel, process decisions rely on accurate optical data, not just averaged panel performance. Repeating the analysis after each process adjustment helps manufacturers to verify improvements and maintain tighter process control throughout display development.
Practical Applications in the OLED Lifecycle and Evaluation
Research laboratories use a microscope spectrophotometer to characterize new organic emitter molecules, phosphorescent materials, thermally activated delayed fluorescence emitters, and quantum dot color converters. Detailed spectral analysis establishes baseline OLED displays colorimetry before candidate materials move into pilot production.
Manufacturing engineers apply the same measurements during production quality control. Pixel-to-pixel luminance variation, chromaticity shifts, and localized non-uniformity become visible prior to developing into visible mura across finished smartphone displays, automotive instrument clusters, or virtual reality microdisplays. Engineers can also generate spectral maps across display panels to identify recurring process variations and support continuous manufacturing improvement. Additional value comes from angular color shift evaluation. Scientists can measure spectral changes at multiple viewing angles to understand how flexible displays, curved automotive panels, and near-eye optical systems maintain color fidelity under realistic operating conditions.
Precision Tools for OLED Measurement and Analysis
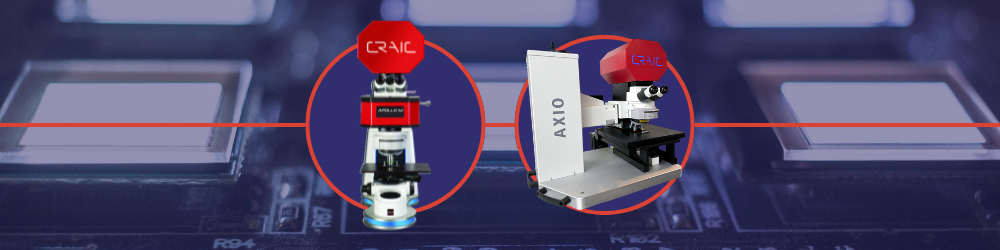
Producing exceptional OLED displays necessitates measurement techniques that match the microscopic scale of modern display architectures. The 2030PV PRO™ Microspectrophotometer and 2030XL PRO™ Microspectrophotometer from CRAIC Technologies combine precision optical microscopy with advanced spectroscopy to characterize individual OLED emitters while avoiding damaging the display. Broad spectral coverage from the deep UV to the near-infrared, automated mapping capabilities, and NIST-traceable calibration offer reliable data for material evaluation, process optimization, and production quality control. Contact CRAIC Technologies today to see how our 2030PV PRO™ and 2030XL PRO™ Microspectrophotometers can improve the accuracy, repeatability, and efficiency of your OLED measurements.
References
- CRAIC Technologies. Spectral Measurements of Individual Pixels of OLED Displays. AZoM. https://www.azom.com/article.aspx?ArticleID=4880. Published 2nd February 2024. Accessed 2nd July 2026.
