Measuring the Energy Content of Coal
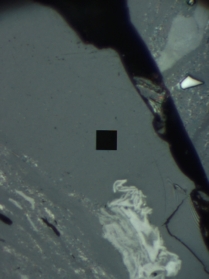
Coal is made up a macerals. Macerals are the organic component of coal, kerogen or other petroleum source rocks. Examples of macerals include vitrinite, inertinite and liptinite. Vitrinite is one of the primary components of coal, petroleum source rocks and sedimentary kerogens. Under a microscope, it has a shiny appearance and is derived from the cell-wall material or woody tissue of plants. Since vitrinite changes predictably with heating (over geological time periods), vitrinite reflectance levels are a reliable measurement of a coal sample's thermal maturity thus its value as a source of energy. As such, methods have been developed to measure the percentage of reflected light from a coal sample and to determine the thermal maturity or rank of the coal sample and thus the energy content of that sample. Vitrinite reflectance measurements are also used on petroleum source rocks and sedimentary kerogens to measure their thermal maturity and thus the type of petrochemicals that they contain. Reflectance values between 0.5 to 1.3% are considered optimal for these types of samples.
How to Measure Vitrinite Reflectance
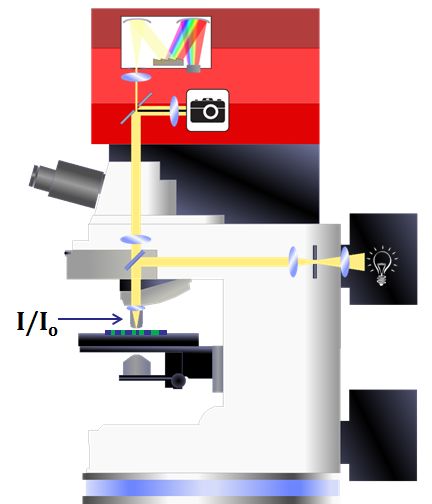
The measurement of vitrinite reflectance is defined by both ISO and ASTM standards methods (as well as other national standards). ISO 7404-5 and ASTM D2798 both state that measuring the vitrinite reflectance of coal is to be done with a specially configured microscope using a calibrated photometer. The microscope is configured for incident illumination with green light where the illuminating light may be either plane-polarized or not. The reflected light intensity is measured with either a photometer, a spectrophotometer or with a digital camera fitted to the microscope.
The system is calibrated with special Vitrinite Reflectance Standards, supplied by CRAIC. The sample is then placed on the sample stage and brought into focus. Using the standard methodology, at least 100 measurements are made of the sample. This allows the user to test blends that contain coals of different ranks. From the data, the mean and standard deviation of all the readings are calculated as percent reflectance. The spread of the individual reflectance values is also plotted as a histogram. This allows the user to determine the different macerals and types of macerals in a sample. This data will give an indication of the rank of the coal sample.
For more detail on vitrinite reflectance, visit the following pages:
ISO 7404-5 Method of Determining MIcroscopically the Reflectance of VitriniteASTM D2798 Standard Test Method for Microscopical Determination of the Vitrinite Reflectance of Coal
Revolutionize Your Microscopy with Raman spectroscopy!
Optical microscopes are staples in many laboratories, typically used to magnify samples for better observation. However, with the addition of a laser, a Raman spectrometer, and an advanced optical interface from CRAIC Technologies, your microscope can do much more!
CRAIC Raman spectrometers are designed to measure Raman spectra of microscopic samples or small areas of larger objects. While standard Raman spectrometers analyze samples around 1 x 1 centimeters, CRAIC's Raman microscope spectrometers can measure samples as small as 1 x 1 micrometers, much thinner than a human hair.
The Apollo Raman systems are modular units that integrate seamlessly with upright optical microscopes, adding powerful Raman spectroscopy capabilities. With CRAIC Technologies products, you can quickly and non-destructively acquire high-quality Raman spectra from sub-micron samples.
As depicted in the diagram, the Apollo Raman module integrates with the frame of an upright optical microscope. This module includes lasers, the Raman spectrometer, and integration optics. The laser illuminates the sample, and the Raman spectrometer measures the light collected by the objective and focused onto the spectrometer entrance aperture.
CRAIC microscope spectrometers offer even more capabilities. They can be configured to measure UV-VIS-NIR microspectra™ in transmission, reflectance, fluorescence, and photoluminescence. Additionally, they are capable of microspot thin film thickness and colorimetry measurements.
Unlock new dimensions in microscopic analysis with CRAIC Technologies' advanced Raman spectroscopy solutions!
Unlock the Full Potential of Your Microscope with CRAIC Raman Spectroscopy!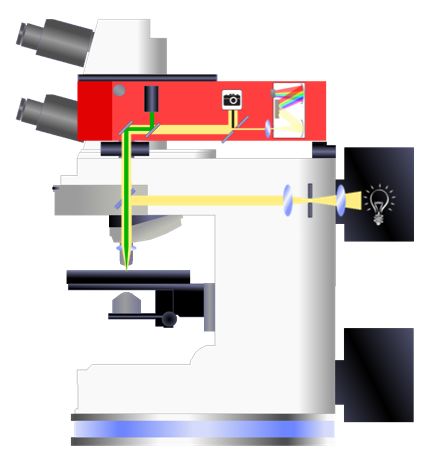

Lab On A Chip Analysis

Microspectrophotometers are used to analyze lab-on-a-chip test points by reflectance, absorbance and fluorescence
![]()
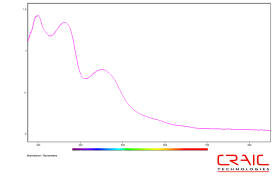
Typical test spectra
Rapid spectral analysis of microscopic test areas in Lab On A Chip devices.
Lab On A Chip devices, sometimes called microfluidic devices, are designed to replicate a series of full-scale chemical and biological reactions on a single micro-scale device. They are sometimes called microelectromechanical systems (MEMS) for their fluid handling capabilities on the microscopic scale. As such, a single device is used replicate a series of chemical reactions but on a microscopic scale. Therefore analytical techniques are required that can measure whether reactions have reached a successful conclusion but of micro-scale volumes.
Able to analyze micro-scale volumes by absorbance, reflectance or even fluorescence, microspectrophotometers are easy-to-use and very accurate. Their flexibility and accuracy make them very important when developing or using custom lab-on-a-chip devices.
To learn more about microspectroscopy and lab-on-a-chip development and testing, select one of the following links:
What is a Microspectrophotometer?
Science of Microspectrophotometers
Proteins and Protein Crystals

Ultraviolet absorbance image of a protein crystal in solution
![]()
Ultraviolet Absorption of Proteins
Advantages of UV Absorption of Protein
Intrinsic Fluorescence of Protein
Science of Microspectrophotometers
Design of Microspectrophotometers
Ultraviolet Absorption Microscope
Ultraviolet Absorption Microspectrophotometer
Absorbance microspectra™ of protein crystal
Protein crystals can be quickly located & identified by UV microscopy.
Proteins are essential parts of living beings and participate in almost every cellular process. They consist of linear chains of amino acids bound to one another. There are 22 standard or proteinogenic amino acids and a host of others. The protein is defined by its primary, secondary and tertiary structures. The primary structure is the sequence of amino acids. The secondary structures are stabilized repeating local structures, such as alpha helices and beta sheets. Finally, the tertiary structure is the three dimensional structure of the protein as a whole.
Protein crystals are grown for a number of different reasons. Protein crystallization is used for drug design and for bioseparation. One of the most important facets is to grow protein crystals so that their tertiary structures canbe studied by x-ray diffraction.
Protein Crystallization
Protein crystallization is a challenging process due to the delicacy of the protein crystal. It is most commonly done by a vapor diffusion method. Crystals are induced to form from a droplet of a protein-saline solution. Water vaporizes from the drop into a reservoir until the concentration of the protein in the drop is high enough for crystallization. Under the correct conditions, a crystal can then be grown. Of course, one disadvantage of this technique is that salt crystals can also be grown with the protein crystals.
Problems and Solutions with Protein Crystallization
Besides being very fragile in nature, differentiating protein crystals from the salt crystals that form with them is quite challenging. To the naked eye or under a common microscope, both appear identical in most cases. However, there are two optical methods that can be used to differentiate them.
UV Absorption of Proteins: The fastest and safest method is to separate protein crystals from salt crystals by using a UV microscope or microspectrophotometer. The protein absorbs light at 280 nm. The salt crystal does not. The image and the spectra of the protein crystal are dramatically different from a salt crystal.
Intrinsic Protein Fluorescence: If the protein contains tryptophan, the crystal can be induced to fluoresce albeit weakly while the salt crystal cannot. This a slower method, however, imaging and spectroscopy can then be used to successfully separate the protein from the salt crystals.
OLED Metrology
![]()
Microspectrophotometers are used to test the color and intensity of each OLED pixel
![]()
![]()
Typical test spectra from three pixels of an OLED display
OLED Inspection: Color, relative intensity, spectroscopy and film thickness of OLED pixels and light sources.
The organic light emitting diode, or OLED, is a light emitting diode that utilizes organic compounds to emit light. The basic OLED is made of an a cathode, an emissive layer, a conductive layer, a substrate and an anode. Placing a charge across the layers causes the emission of photons from the emissive layer by the process of electrophosphorescence. Different types of organic molecules and different manufacturing processes result in various colors and display designs.
Due to the nature of organic light emitting diode devices, they can be manufactured by a printing process that causes rows of microscopic pixels to be deposited on a surface. Such designs will lead to the common use of OLED devices as displays and light sources. Because each pixel is its own colored light source, OLED devices use less power and are smaller and lighter than comparable LED displays. They also have superior black levels. As such, OLED displays and light sources are in great demand.
Development testing and quality control of both the components and completed OLED devices are done by optical microspectroscopy. Microspectrometers, such as those made by CRAIC Technologies, are used to measure the spectra and the intensity of the output from individual pixels and from groups of pixels. They are even used to map the color and intensity outputs of entire displays. This is important as manufacturers of organic light emitting diodes need to make sure that all the different types of pixels are the same color and brightness. A microspectrophotometer does this quickly and easily.
To learn more about microspectroscopy and OLED analysis and testing, select one of the following links: