Contrast Ratios of Displays
Figure 1: Microspectrometers are used to measure the contrast ratio of each pixel
![]()
Figure 2: Typical test spectra from a display. Intensities can be directly compared between pixels.
The contrast ratio of individual pixels and microdisplays can be measured and compared using microspectrometers.
Flat panel displays consist of a series of colored lighted areas arranged in a pattern and can only be readily viewed with magnifying optics. Due to the high resolution of flat panel displays, they are manufactured with hundreds of rows of microscopic "pixels" on a surface. Generally, these pixels are red, blue and green though pixels with other colors are also made...for example the latest four color systems also incorporate yellow pixels.
One aspect of display quality control consists of making sure that the contrast ratio of each pixel does not vary across the entire display. For example, all the green pixels should have the same contrast ratio no matter where they are positioned in the display.
Microspectrometers are able to gather contrast ratio data from single pixels and from groups of pixels (if you are interested in mura). Additionally, microspectrometers are also able to map the relative intensity variation within even a single pixel! This leads to a new level of precision for improved displays.
The way a microspectrometer works is that spectrophotometer entrance aperture is placed over the pixel or pixels in questions. The black square in Figure 1 is an example. The spectra is then acquired and will look something like the three spectra in Figure 2. Using the Lambdafire™ software, the intensity data is compared with measurements of other pixels to show that the brightness of each sampled area is within the manufacturing parameters. A high resolution map of the relative intensities can then be generated.
Learn more about microscopic contrast ratio measurements of displays below:
Chromaticity of Displays
Figure 1: Microspectrometers are used to test the color of each pixel
![]()
Figure 2: Typical test spectra from a display. Color coordinates can be calculated from these spectra.
Chromaticity of individual pixels and groups of pixels can be measured and compared using microspectrometers.
Flat panel displays consist of a series of colored lighted areas arranged in a pattern and can only be readily viewed with magnifying optics. Due to the high resolution of flat panel displays, they are manufactured with hundreds of rows of microscopic "pixels" on a surface. Generally, these pixels are red, blue and green though pixels with other colors are also made...for example the latest four color systems also incorporate yellow pixels.
Chromaticity is used in display development to optimize the colors. Quality control consists of making sure that the color of each of the pixels does not vary across the entire display. For example, all the green pixels should have the same shade of green.
Microspectrometers are able to gather microcolorimetric data from single pixels and from groups of pixels (if you are interested in mura). Additionally, microspectrometers are also able to map the microcolorimetric variation within even a single pixel! This leads to a new level of color precision for improved displays.
The way a microspectrometer works is that spectrophotometer entrance aperture is placed over the pixel or pixels in questions. The black square in Figure 1 is an example. The spectra is then acquired and will look something like of the spectra in Figure 2. Using the CRAIC ColorPro™ software, microcolorimetric data is generated. This can be compared with measurements of other pixels to show that the color of each sampled area is within the manufacturing parameters.
Learn more about microscopic chromaticity analysis of displays:
Luminance Measurements of Displays
Figure 1: Microspectrometers are used to measure the intensity of each pixel
Figure 2: Typical test spectra from a display. Intensities can be directly compared between pixels.
The luminance, intensity or brightness of individual pixels and groups of pixels can be measured and compared using microspectrometers.

Flat panel displays consist of a series of colored lighted areas arranged in a pattern and can only be readily viewed with magnifying optics. Due to the high resolution of flat panel displays, they are manufactured with hundreds of rows of microscopic "pixels" on a surface. Generally, these pixels are red, blue and green though pixels with other colors are also made...for example the latest four color systems also incorporate yellow pixels.
One aspect of display quality control consists of making sure that the brightness or luminance of each pixel does not vary across the entire display. For example, all the green pixels should have the same brightness no matter where they are positioned in the display.
Microspectrometers are able to gather relative intensity data from single pixels and from groups of pixels (if you are interested in mura). Additionally, microspectrometers are also able to map the relative intensity variation within even a single pixel! This leads to a new level of precision for improved displays.
The way a microspectrometer works is that spectrophotometer entrance aperture is placed over the pixel or pixels in questions. The black square in Figure 1 is an example. The spectra is then acquired and will look something like the three spectra in Figure 2. Using the Lambdafire software, the intensity data is compared with measurements of other pixels to show that the brightness of each sampled area is within the manufacturing parameters. A high resolution map of the relative intensities can then be generated.
Learn more about luminance measurements of displays below:
Raman spectroscopy with a microscope!
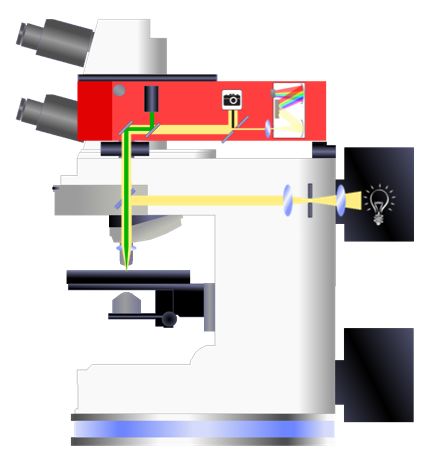
Optical microscopes are routinely found in a wide variety of laboratories, but they are often only used as a magnifying glass to allow the user to better see the sample. But when CRAIC Technologies adds a laser and a Raman spectrometer, along with an advanced optical interface, you can do so much more! CRAIC Raman spectrometers are designed to measure Raman spectra of microscopic samples or microscopic areas of larger objects. While a standard Raman spectrometer is designed to measure samples on the order of 1 x 1 centimeters, the Raman microspectrometer is able to measure samples on the order of 1 x 1 micrometers...much smaller than the thickness of a human hair. The Apollo Raman systems are modular units that are installed on an upright optical microscopes to add Raman microspectroscopy capabilities. With CRAIC Technologies products, you can acquire high quality Raman spectra of even sub-micron samples rapidly, non-destructively and with ease.
As shown in the diagram on the right, the Apollo Raman module is integrated with the frame of an upright optical microscope. The module includes the lasers, the Raman spectrometer and integration optics. The laser illuminates the sample and the Raman spectrometer measures the light that is collected by the objective and focused onto the Raman spectrometer entrance aperture.
Of course, CRAIC Raman microspectroscopy systems can also do much more. They can also be configured to measure UV-VIS-NIR microspectra™ in transmission, reflectance, fluorescence and photoluminescence. They are also capable of microspot thin film thickness and colorimetry measurements.
Adding spectroscopy to your microscope!
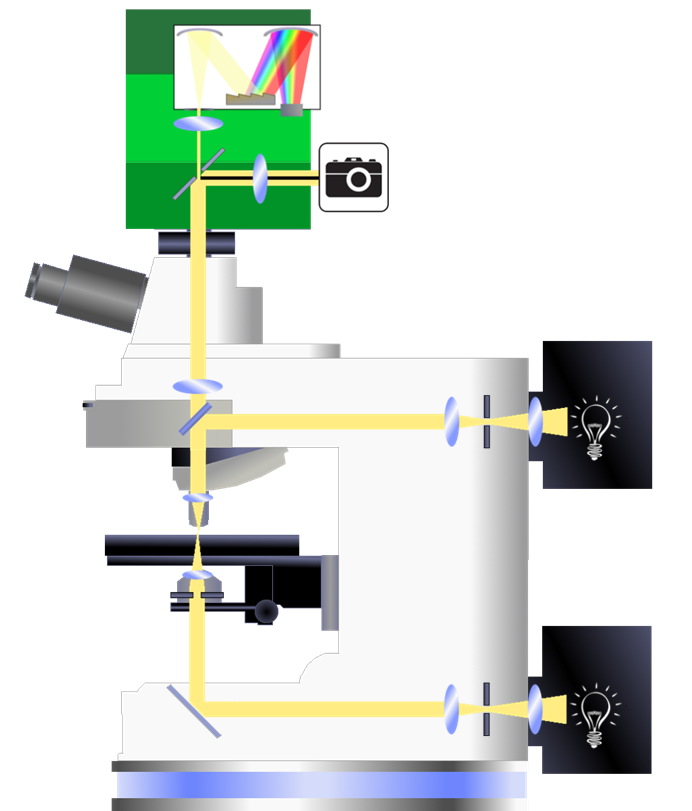
Optical microscopes are routinely found in a wide variety of laboratories, but they are often only used as a magnifying glass to allow the user to better see the sample. However, even an inexpensive microscope can be upgraded to do so much more! By sending the light from the microscope to a spectrometer, many different types of spectra can be measured with a much smaller sampling area than is capable with a standard bench-top spectroscopy tool, such as transmission, reflection, fluorescence, and other types of optical emission. Micro spectrometers (or microspectrophotometers / MSP) are designed to measure UV-VIS-NIR spectra of microscopic samples or microscopic areas of larger objects. While a standard spectrophotometer is designed to measure samples on the order of 1 x 1 centimeters, the micro spectrometer is able to measure samples on the order of 1 x 1 micrometers...much smaller than the thickness of a human hair. The 508 PVTM micro spectrometer is a modular head unit that can be installed on the open phototube port of most upright microscopes to add spectroscopy to your microscope. With CRAIC Technologies products, you can acquire high quality spectra of even sub-micron samples rapidly, non-destructively and with ease.
As shown in the diagram on the right, the MSP head unit can be added to the photoport of a microscope, and the spectrometer measures the light that is collected by the objective and focused onto the spectrophotometer entrance aperture. Whether this light is transmitted through the sample, reflected from the sample, or emitted by the sample, that only changes the calculations done on the light intensity measured.
Beyond just measuring UV-VIS-NIR spectra with microscale sampling areas, microscope spectrophotometers are also capable of microspot thin film thickness and colorimetry measurements. When combined with motorized stages, hyperspectral data cubes can even be created with various types of spectra. Because these instruments are so flexible, MSP's are used in many diverse fields of research and industry.